Core Services & Validations
We provide specialized chemical profiling and non-target screening (NTS) solutions across three core matrices, backed by rigorous scientific literature and peer-reviewed validations.
Characterization of Plant-Derived & Plant Based Products
We offer specialized chemical characterization for plant-derived raw materials, food products, and botanical extracts. Using advanced gas- and liquid chromatography coupled with high-resolution mass spectrometry, we map lipidic and polar profiles to verify purity, track degradation, and support product development. Our testing categories include:
Lipidic Bioactives in Plant-Derived Products
We offer comprehensive exploratory analysis, compound identification, and quantification for a subset of non-glyceridic lipids. Using high-temperature GC-MS approaches, we map sample profiles to assess raw material quality and characterization.
Analyte Focus
- Phytosterols: Including Δ7-sterols (e.g., spinasterol).
- Triterpenes: Pentacyclic and tetracyclic triterpene alcohols, along with their corresponding acetate and cinnamate esters.
- Tocopherols: Vitamin E isomers for quality control and shelf-life profiling.
- Fatty Acids & Esters: Free fatty acids (FFAs), fatty acid methyl esters (FAMEs), and fatty acid ethyl esters (FAEEs).
Identification & Quantification
We provide absolute quantification utilizing authentic chemical standards. For rare or commercially unavailable compounds, we utilize structurally and chemically related analogue standards, employing precise relative intensity correction factors derived from extensive MS library spectral data.
Polar Bioactives in Plant-Derived Products
We offer comprehensive exploratory analysis, compound identification, and quantification for a subset of phenolics and saponins. Utilizing reversed-phase ultra-high-pressure liquid chromatography and high-resolution mass spectrometry, we provide detailed profiling of polar secondary metabolites.
Analyte Focus
- Phenolics & Saponins: Profiling and relative quantitation.
- Monomeric Flavonoids: Highly targeted analysis (e.g., quercetin, luteolin).
- Flavornoid Glycosides: Characterization of polar secondary metabolites.
Identification & Quantification
Compounds are identified by retention times, high-resolution mass spectrometry fragmentation experiments, and comparisons to either mass spectral libraries or authentic standards (when available). For selected polar compounds, we offer targeted absolute quantification.
Qualitative Lipid Profiling
As a complementary service, we provide qualitative lipid profiling to observe general degradation patterns across samples. We extract LC-HRMS profiles to compare the overall integrity of the lipid matrix.
Matrix Assessment
- Neutral Lipids: Profiling of tri- and diglycerides to observe general degradation patterns.
- Polar Lipids: Profiling of glycolipids and phospholipids to compare the overall matrix integrity.
NTS as a decision-support tool for environmental quality
Traditional target analysis monitors only predefined contaminants. NTS Analytica uses chromatography and high-resolution mass spectrometry to characterize chemical fingerprints and detect, track and identify known and unknown organic micropollutants in environmental samples.
NTS as a decision-support tool for wastewater quality
What is in the wastewater?
- ▢ Characterize the chemical fingerprint of municipal and industrial wastewater beyond routine target lists.
- ▢ Detect compounds that are often poorly covered by standard methods, including very polar and volatile chemicals.
- ▢ Identify relevant compound groups such as pharmaceuticals and their metabolites and transformation products, pesticides, industrial additives, surfactants, PFAS, corrosion inhibitors.
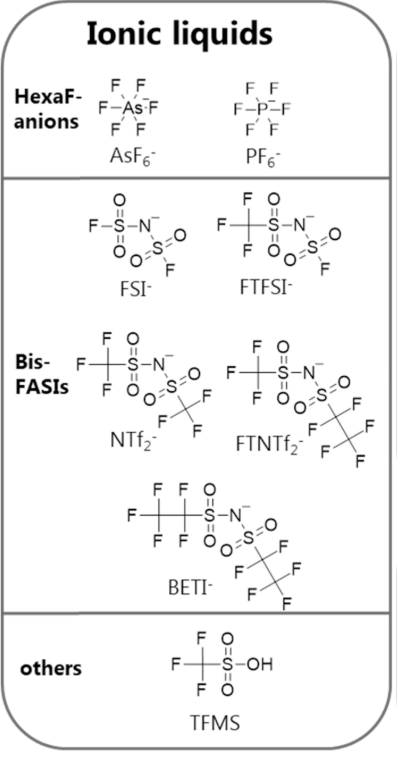
Figure 1: Example of rarely detected or newly identified chemicals of the compound class "ionic liquids" in wastewater, whose fate can be tracked throughout the wastewater treatment process. Modified from Tisler et al., 2025b.
Where do the chemicals come from?
- ▢ Use chemical fingerprints for source tracking of industrial spills, pinpointing discharges and other contamination events.
- ▢ Distinguish between municipal and industrial contributions based on characteristic chemical profiles.
- ▢ Identify likely sources or industrial sectors behind unknown discharges without predefined target lists.
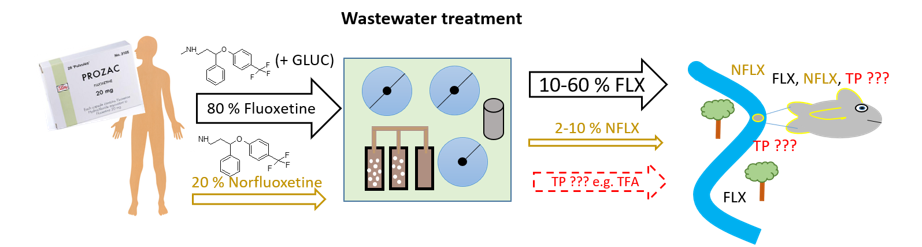
Figure 2: Identification of chemicals before and after wastewater treatment, as well as in the environment (e.g., fate of the pharmaceutical Fluoxetine). Modified from Tisler et al., 2019.
What happens during wastewater treatment?
- ▢ Track changes in the chemical fingerprint through treatment: which compounds are removed, persist, or form as transformation products.
- ▢ Evaluate treatment performance beyond a limited set of target compounds.
- ▢ Identify compounds that pass through treatment and may reach receiving waters.
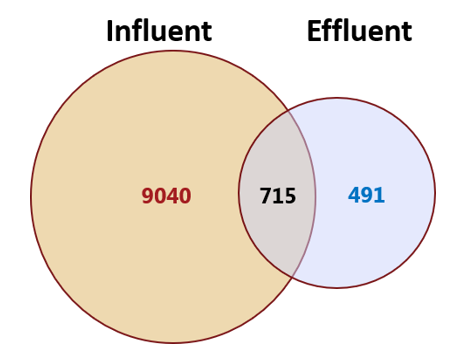
Figure 3: Example of simple NTS evaluation based on chromatographic peaks to evaluate treatment performance. Modified from Tisler et al., 2022b.
How does the chemical profile change over time?
Monitor temporal variation in discharge composition to detect seasonal patterns, process changes, or irregular emission events. Follow the evolution of industrial effluent over time to assess compliance, and establish chemical baselines that enable early warning when unexpected substances enter the system.
NTS as decision support tool for drinking water quality
What is in the drinking water?
- ▢ Find, prioritize, and act on unknown contaminants that routine target lists miss.
- ▢ Support early warning for emerging contaminants, and guide follow-up decisions such as confirmation, treatment evaluation, and monitoring design.
- ▢ Example compounds: unconventional PFAS, pesticide transformation products/metabolites, plasticizer.
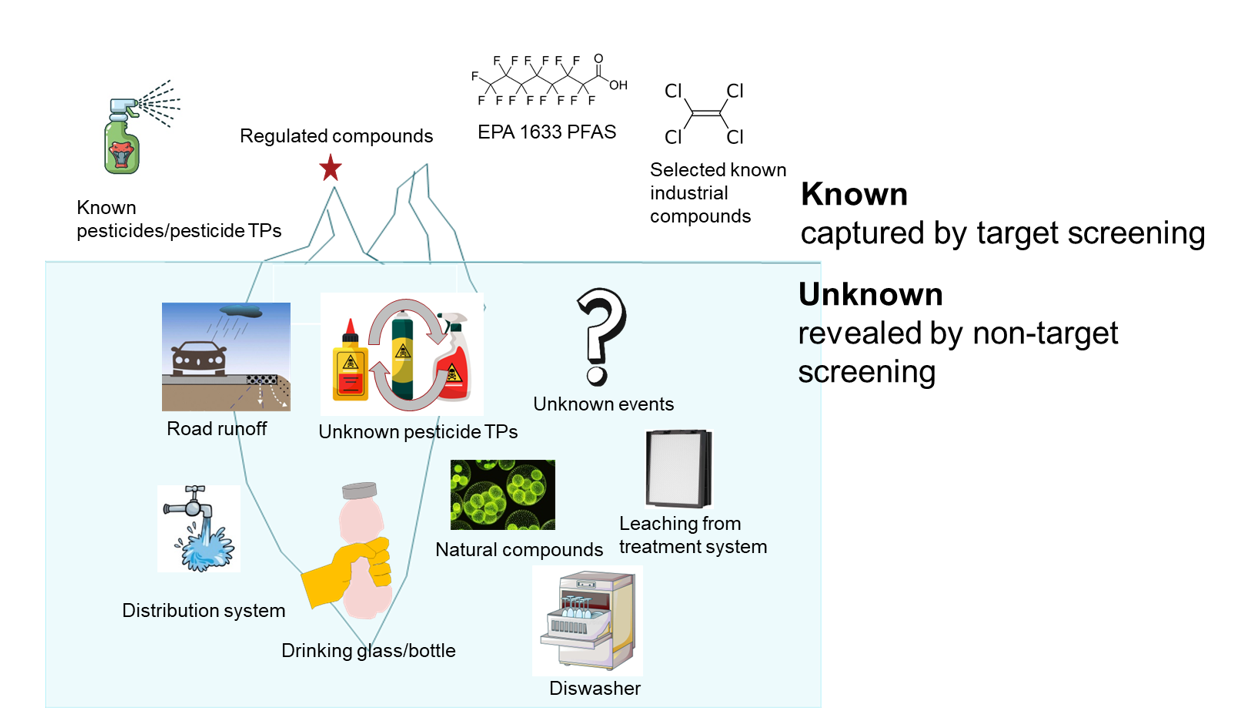
Figure 1: Example of known and unknown compounds occurring in drinking water. Modified from Tisler et al., 2025.
What happens in drinking water treatment?
- ▢ Track the fate of the chemical fingerprint: how many features are degraded, stable, or formed in the treatment process.
- ▢ Follow the fate of identified contaminants.
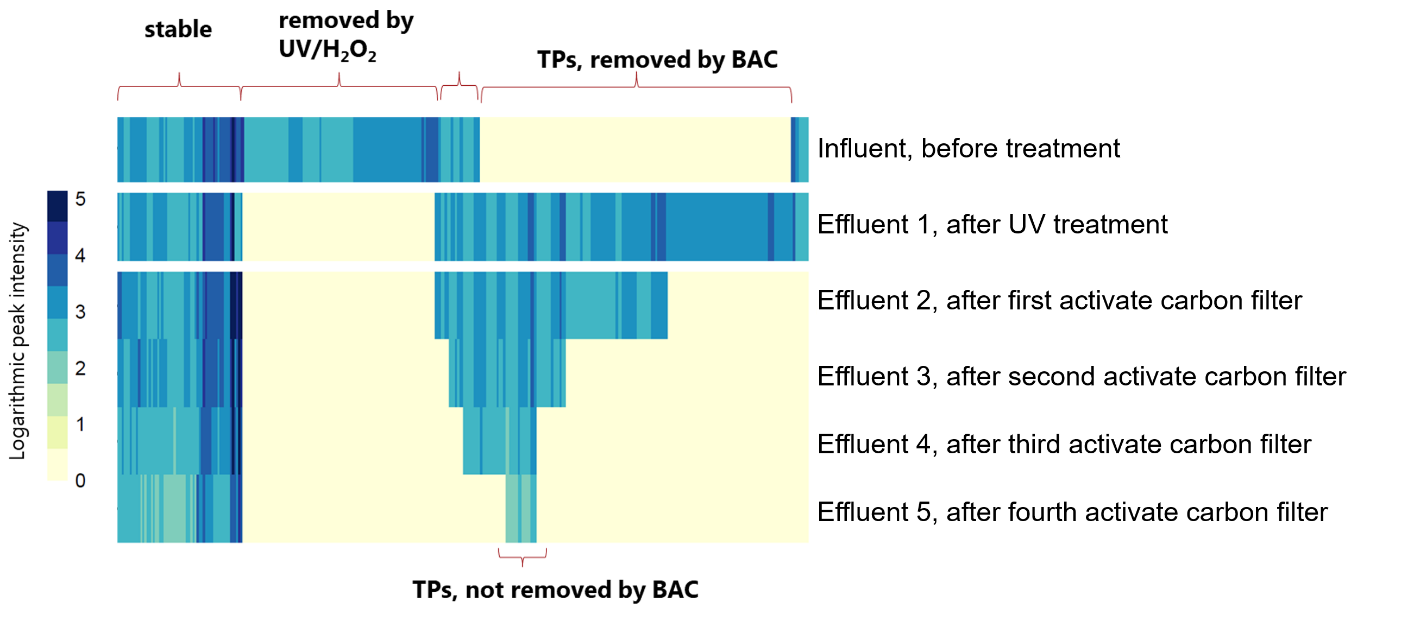
Figure 2: Micropollutant and transformation product fate mapping through advanced oxidation processes and activated carbon filtration. Modified from Tisler et al., 2022.

Figure 3: Chemical fingerprinting showing the migration of rubber compounds (from seals) and plasticizers in a high-density polyethylene (HDPE) drinking water distribution system. Modified from Diera et al., 2023.
NTS as a decision-support tool for hydrocarbon contamination
What is in the hydrocarbon contamination?
- ▢ Characterize the full hydrocarbon fingerprint beyond total petroleum hydrocarbons (TPH) and routine target compounds using GC-MS and GC×GC-HRMS.
- ▢ Differentiate crude oils, fuels, lubricants and other petroleum-derived products using characteristic hydrocarbon patterns, PAHs and petroleum biomarkers.
- ▢ Identify the compound groups that dominate the contamination and provide a chemical baseline for source comparison, weathering assessment and remediation follow-up.
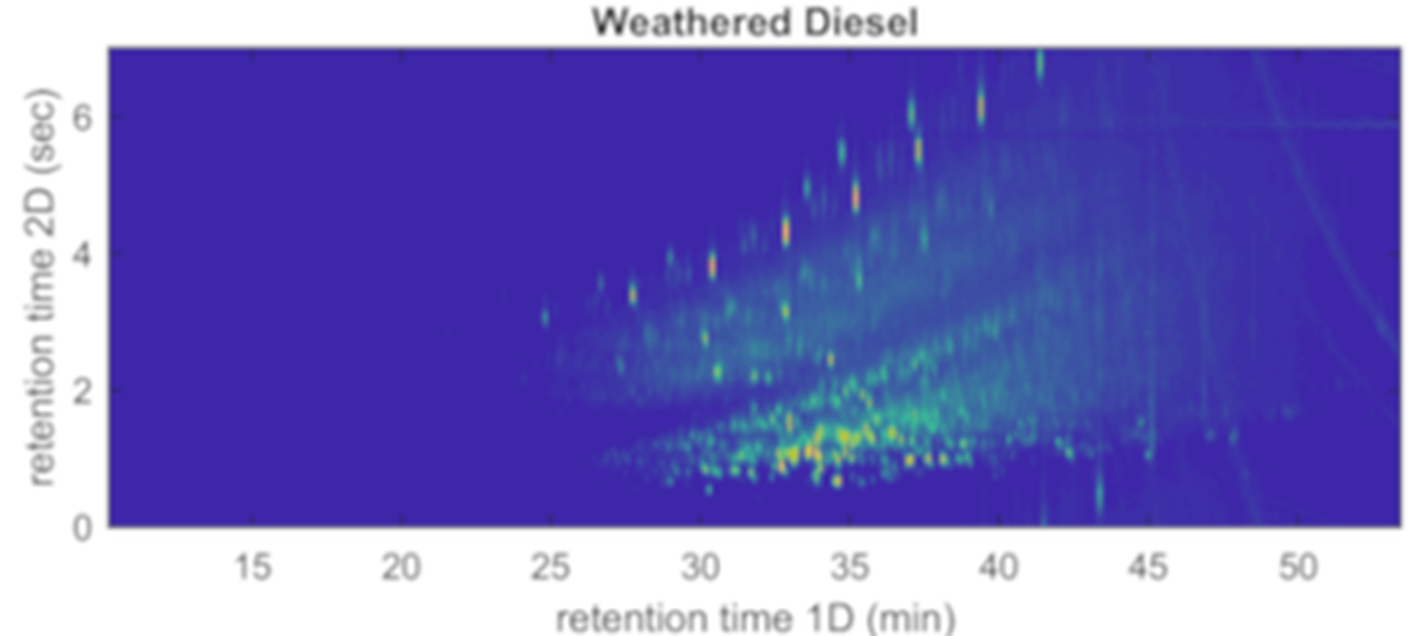
Figure 1: Comprehensive two-dimensional gas chromatography high-resolution mass spectrometry (GC×GC–HRMS) contour plot of a weathered diesel oil spill. The orthogonal separation resolves thousands of volatile and semi-volatile petroleum hydrocarbons along volatility (1D) and polarity (2D) axes, unravelling the unresolved complex mixture (UCM) and enabling pixel-level forensic identification of diagnostic middle-distillate markers even in the absence of conventional hopanes and steranes. Modified from Alexandrino et al., 2019.
Where did the hydrocarbons come from?
- ▢ Compare contaminated environmental samples with suspected source oils or petroleum products.
- ▢ Use chemical fingerprints, diagnostic ratios and persistent petroleum biomarkers to distinguish potential sources, including samples affected by environmental weathering.
- ▢ Assess objectively whether samples are consistent with the same or different sources and identify the chemical features that drive the match or non-match.
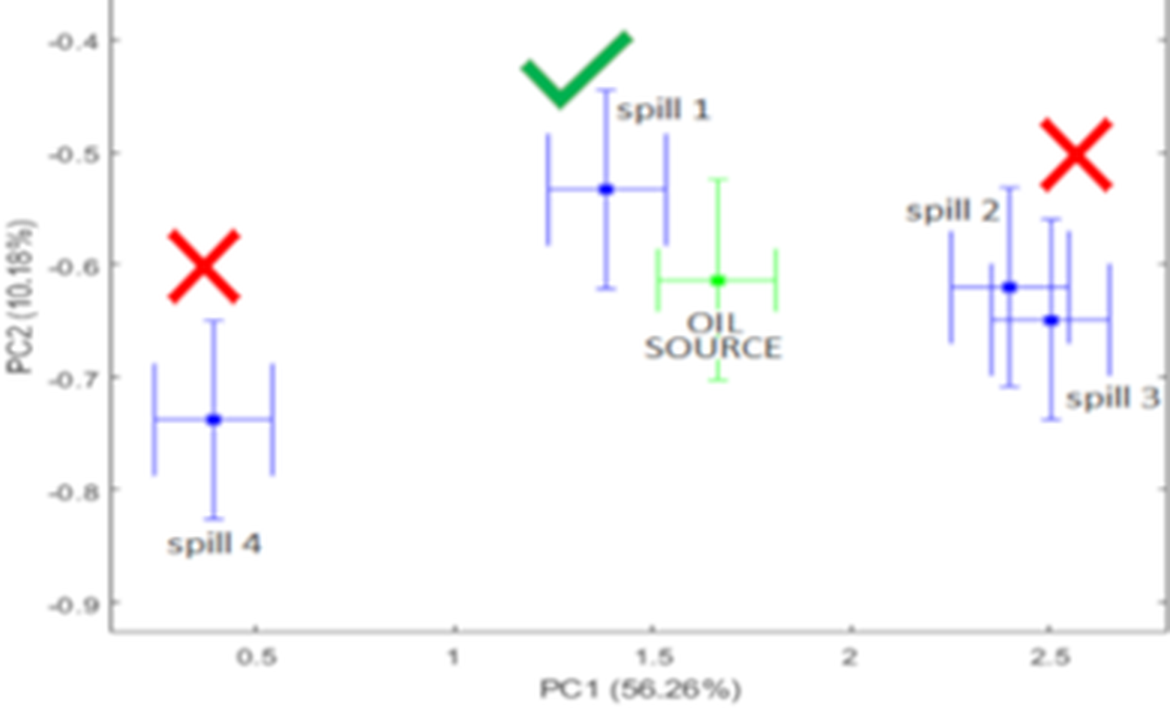
Figure 2: Chemometric forensic matching and source attribution using multi-parameter Principal Component Analysis (PCA) with error bars. Analytical confidence boundaries differentiate candidate source oils from environmental spill samples (e.g., positive match for spill 1 vs. exclusion for spills 2, 3, and 4), establishing legally defensible source identifications. Modified from Alexandrino et al., 2019.
Two Decades of Forensic Research
Our diagnostic workflows build on more than two decades of peer-reviewed hydrocarbon fingerprinting research, combined with advanced GC×GC-HRMS and chemometric data models for complex environmental samples.
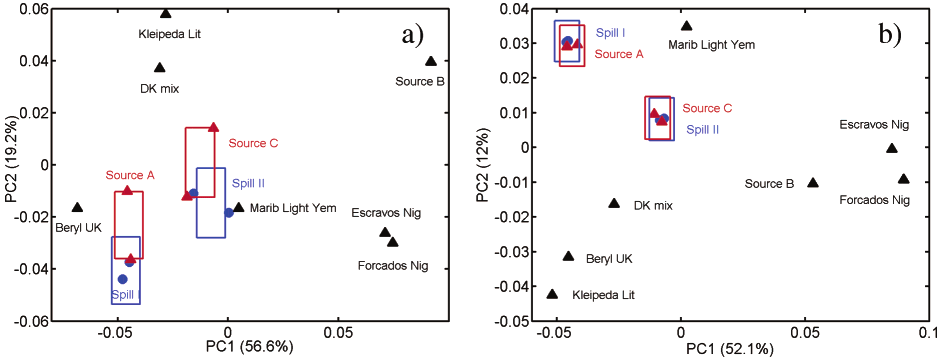
Methodology Highlight: Comparison of (a) ordinary least squares and (b) weighted least squares PCA with analytical tolerance intervals for rigorous spill-source matching. Modified from Christensen et al., 2004.
How does the hydrocarbon fingerprint change over time?
- ▢ Track evaporation, dissolution, biodegradation and other weathering processes that alter hydrocarbon composition after release.
- ▢ Separate changes caused by environmental weathering from inherent differences between oils by focusing on robust fingerprint information and persistent compound groups.
- ▢ Compare samples across locations or sampling times to determine how the contamination evolves and which hydrocarbon classes persist.
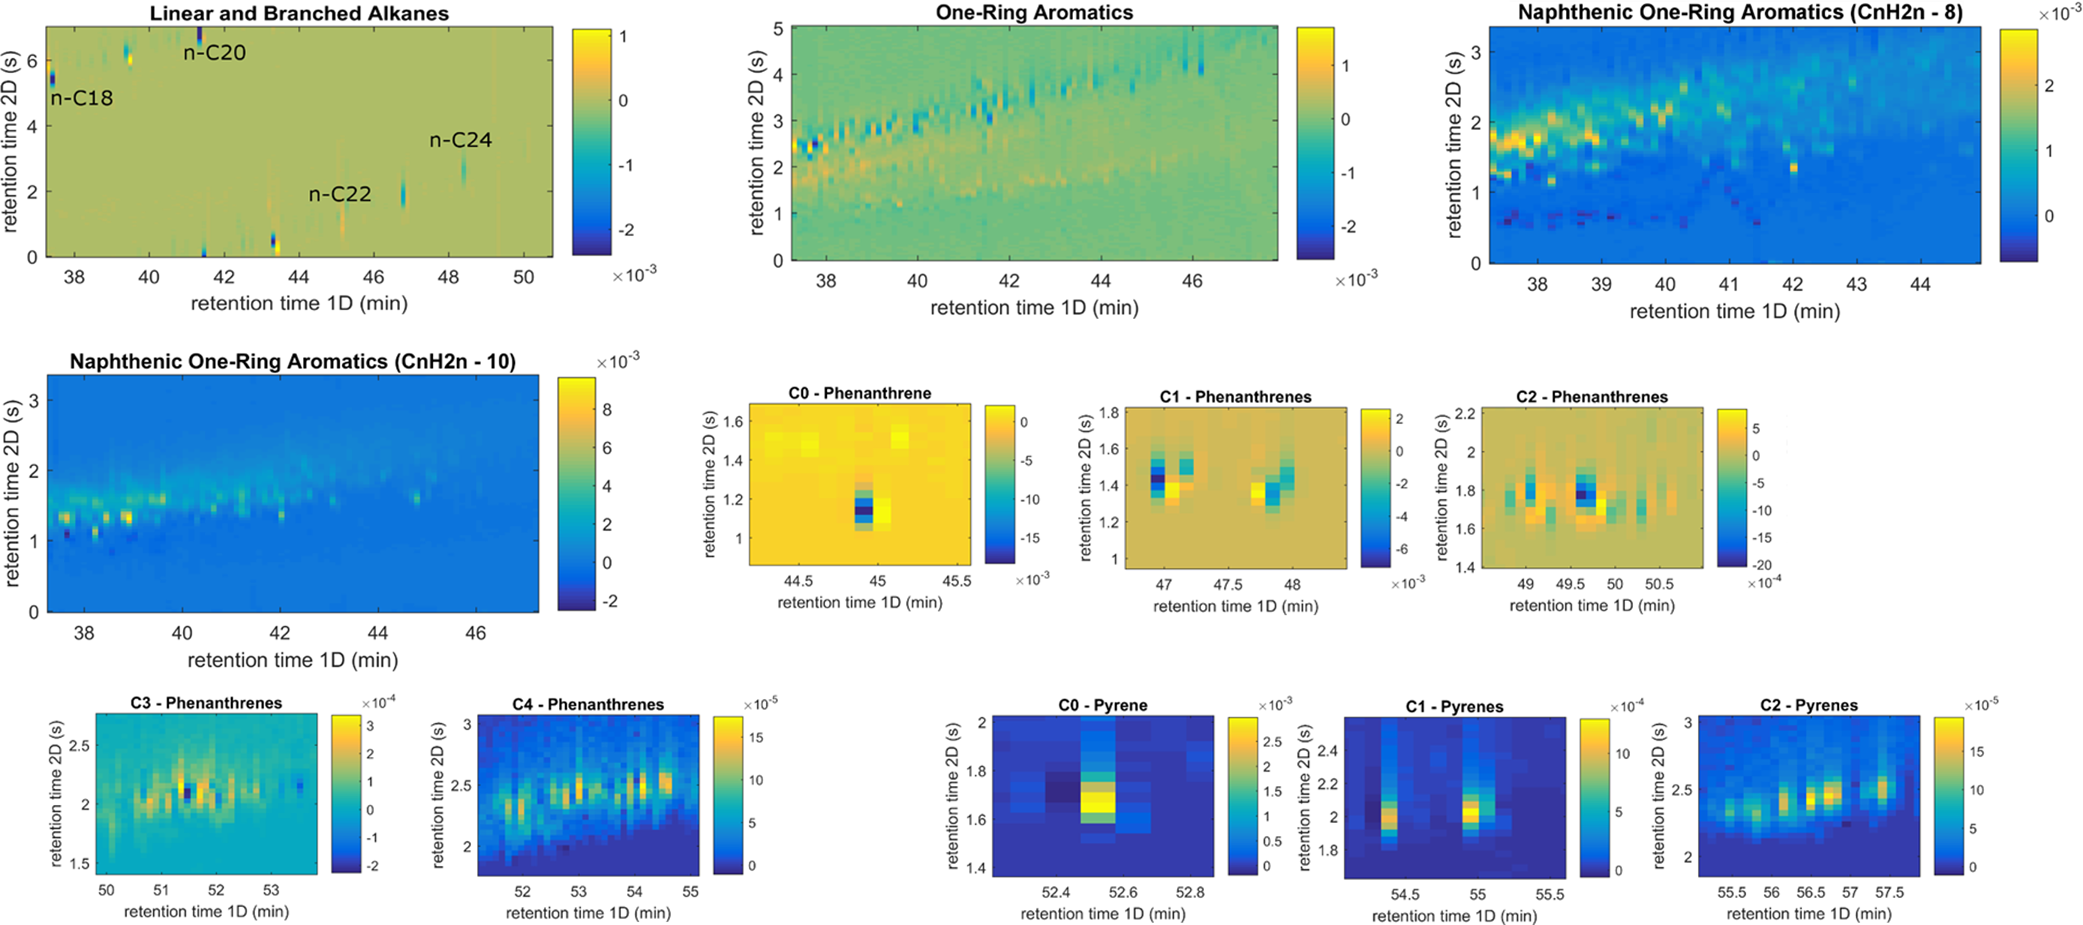
Figure 3: Deconvolution of environmental weathering trajectories and photo-oxidation in diesel oil spills using GC×GC–HRMS pixel-level PC2 loadings. Chemometric modeling separates photo-oxidation and evaporation from source variations across homologous n-alkanes, one-ring aromatics, and multi-ring PAHs (phenanthrenes and pyrenes). Modified from Alexandrino et al., 2019.
Is remediation working?
- ▢ Compare fingerprints before, during and after remediation rather than relying only on changes in total hydrocarbon concentration.
- ▢ Determine which hydrocarbon groups are preferentially removed or biodegraded and which remain.
- ▢ Use changes in the complete chemical profile to evaluate natural attenuation, enhanced bioremediation and other remediation strategies.
Chemical insight for better renewable-fuel decisions
Bio-oils from biomass, waste and residual streams are chemically complex, and their composition changes markedly during production, storage and upgrading. NTS Analytica helps determine what is present, what changes during processing, and which compounds or chemical classes are linked to stability, catalyst performance and product quality. The result is molecular-level information that can be used to select feedstocks, compare process conditions, troubleshoot upgrading and support scale-up.
What is actually in the bio-oil?
Routine bulk parameters cannot show the full molecular composition. We map the chemical fingerprint so you can see the compounds and compound classes that may matter for downstream processing and product quality.
- ▢ Compare feedstocks and batches on a molecular rather than only bulk-property basis.
- ▢ Identify oxygen-, nitrogen- and sulfur-containing classes, reactive oxygenates and other process-relevant components.
- ▢ Prioritise impurities or chemical classes that may affect catalyst life, upgrading severity or final fuel quality.
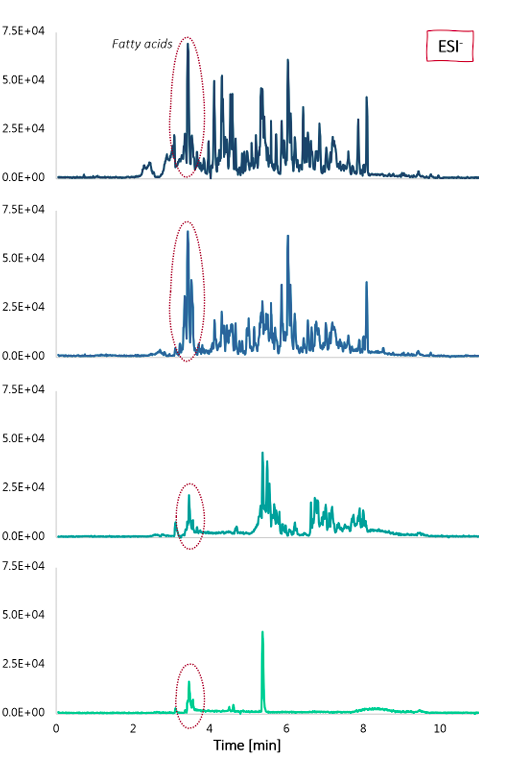
Figure 1: SFC-HRMS BPCs (ESI− 0–11 min) for Feed #01 and Products #07, #10 and #13, showing decreasing nitrogen content with increasing treatment temperature. Selected compound groups are highlighted in red. Modified from Lübeck et al., 2025.
Typical Client Output
A comparative chemical fingerprint, prioritised compound/classes list, interpretation of the process-relevant changes, and a concise conclusion linked directly to your feedstock, process or product decision.
Which feedstock or process conditions give the better product?
Chemical fingerprints can reveal differences that are not apparent from conventional measurements alone. We compare samples across feedstocks, production conditions and pretreatment steps to determine what drives the observed composition.
- ▢ Separate feedstock effects from process effects and quantify batch-to-batch variation.
- ▢ Link chemical classes and individual features to operating conditions and bulk properties.
- ▢ Define fingerprints that can support feedstock qualification, process comparison and quality control.
What changes during upgrading and hydrotreatment?
Upgrading removes some compounds, converts others and can generate new intermediates. We track these changes to show whether the process is moving the product in the intended direction.
- ▢ Determine which compound classes disappear, persist or are formed through the treatment train.
- ▢ Assess conversion of reactive oxygenates and nitrogen-containing species that can influence stability and catalyst performance.
- ▢ Compare operating conditions and identify process windows that achieve the required chemical change without unnecessary treatment severity.
Is the product stable and ready for the next processing step?
Fresh, stabilised and deeply upgraded oils may have similar bulk properties while differing substantially in molecular composition. Fingerprint-based comparison helps explain instability and assess whether further treatment is needed.
- ▢ Track chemical changes during storage or ageing and identify classes associated with oxidation, aggregation or residue formation.
- ▢ Compare untreated, mildly stabilised and deeply upgraded products directly.
- ▢ Support decisions on stabilisation, storage, scale-up and suitability for further refining or blending.